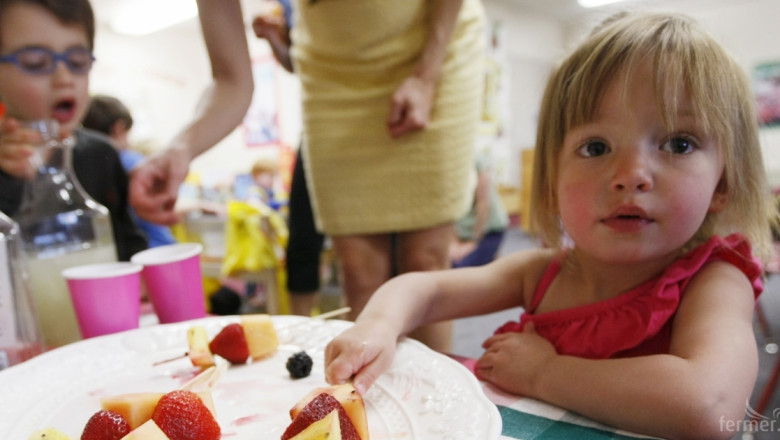
Малко над 3,1 млн. евро ще получи България по схемата Училищен плод и зеленчук за учебната 2016-2017 г. Общият размер по схемата, който отпуска ЕК, е 150 млн. евро и той ще бъде разпределен между 25-те държави членки, които прилагат схемата. Държавите ще подкрепят схемата и със собствено национално съфинансиране в общ размер на около 40 млн. евро.
Това ще бъде осмата година от прилагането на схемата от стартирането ѝ през 2009 г., но тя също така ще бъде последната година на прилагане на схемата, в сегашния ѝ вид.
Училищните програми за мляко, плодове и зеленчуци в ЕС ще бъдат слети в една, като новите правила трябва да влязат в сила от 1 август 2017.
През 2014/2015 учебна година, повече от 10.2 милиона деца в участващите държави-членки са се възползвали от схемата, чрез получаване на порции плодове и зеленчуци в училища и детски градини. Това е ръст от 4% в сравнение с предходната учебна 2013/2014 година.
|
Member State |
Co-financing rate (in %) |
Allocated amount in EUR |
|
Belgium |
75% |
3 369 750 |
|
Bulgaria |
90% |
3 104 247 |
|
Czech Republic |
88% |
4 656 091 |
|
Denmark |
75% |
1 808 638 |
|
Germany |
75% |
30 297 827 |
|
Estonia |
90% |
651 105 |
|
Ireland |
75% |
1 309 313 |
|
Greece |
81% |
3 143 600 |
|
Spain |
75% |
11 054 290 |
|
France |
76% |
15 000 000 |
|
Croatia |
90% |
2 016 686 |
|
Italy |
80% |
25 813 171 |
|
Cyprus |
75% |
290 000 |
|
Latvia |
90% |
939 485 |
|
Lithuania |
90% |
1 335 660 |
|
Luxembourg |
75% |
383 936 |
|
Hungary |
86% |
4 567 759 |
|
Malta |
75% |
352 185 |
|
Netherlands |
75% |
5 434 576 |
|
Austria |
75% |
3 534 301 |
|
Poland |
88% |
17 391 011 |
|
Portugal |
85% |
3 284 967 |
|
Romania |
89% |
6 869 985 |
|
Slovenia |
83% |
844 629 |
|
Slovakia |
89% |
2 546 788 |
|
EU |
79% |
150 000 000 |


;void(0);)
0 КОМЕНТАРА